American Drivers Paid $8.4 Billion In 32 Days—All 50 States Now Above $3 Gas For First Time Since 2023
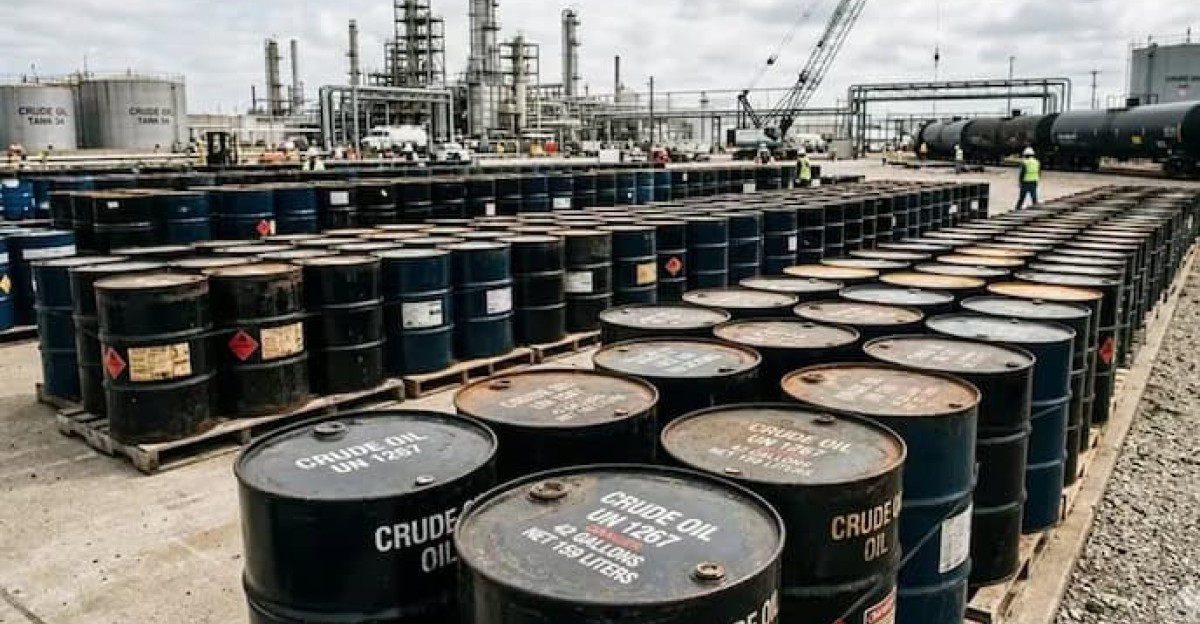
On February 28, U.S. and Israeli forces launched Operation Epic Fury with nearly 900 strikes in 12 hours. Iran responded by shutting down the Strait of Hormuz, blockading 20% of the world’s oil supply. Within 32 days, the national gas average rocketed from $2.99 to $4.06 per gallon. The International Energy Agency called it the largest supply disruption in the history of global oil markets. American households collectively absorbed $8.4 billion in additional fuel costs in that first month alone. The price at the pump told the obvious story. The cascade behind it is far worse.
Why Record Production Couldn’t Save You
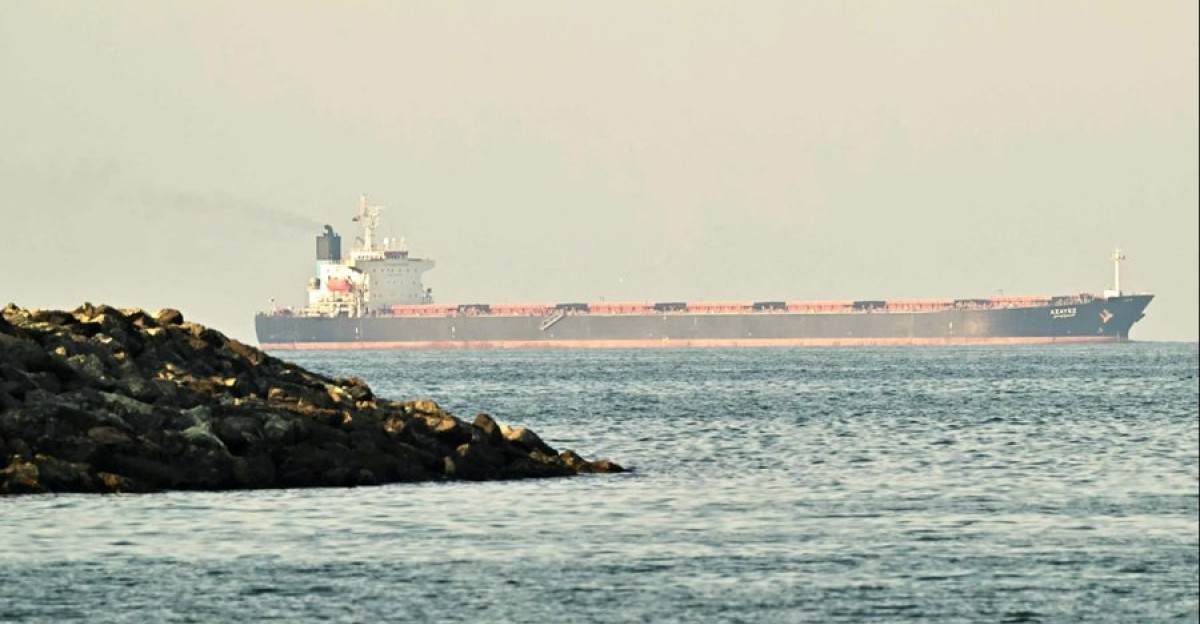
The U.S. produces record volumes of oil and natural gas. None of that mattered. Global oil markets price every barrel based on marginal supply. When one-fifth of the world’s crude vanishes overnight, the remaining 80% gets valued at a scarcity premium regardless of where it was drilled. By March 16, zero tanker ships transited the Strait in a 24-hour period. Normal days see over 100. Goldman Sachs estimated a $14-per-barrel risk premium had already baked into crude by early March, before the worst of it hit. Domestic production volume became a talking point, not a shield.
The Pump Hit Every Kitchen Table
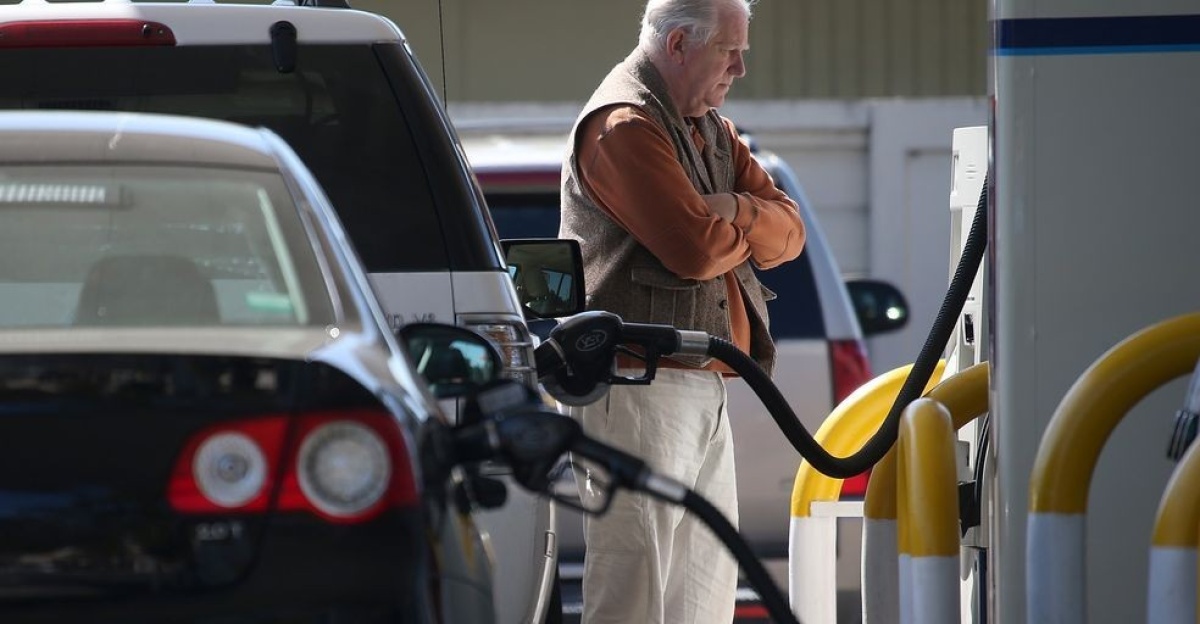
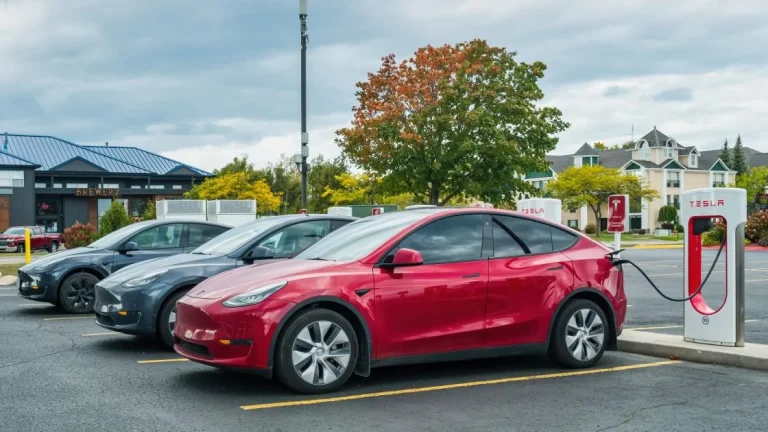
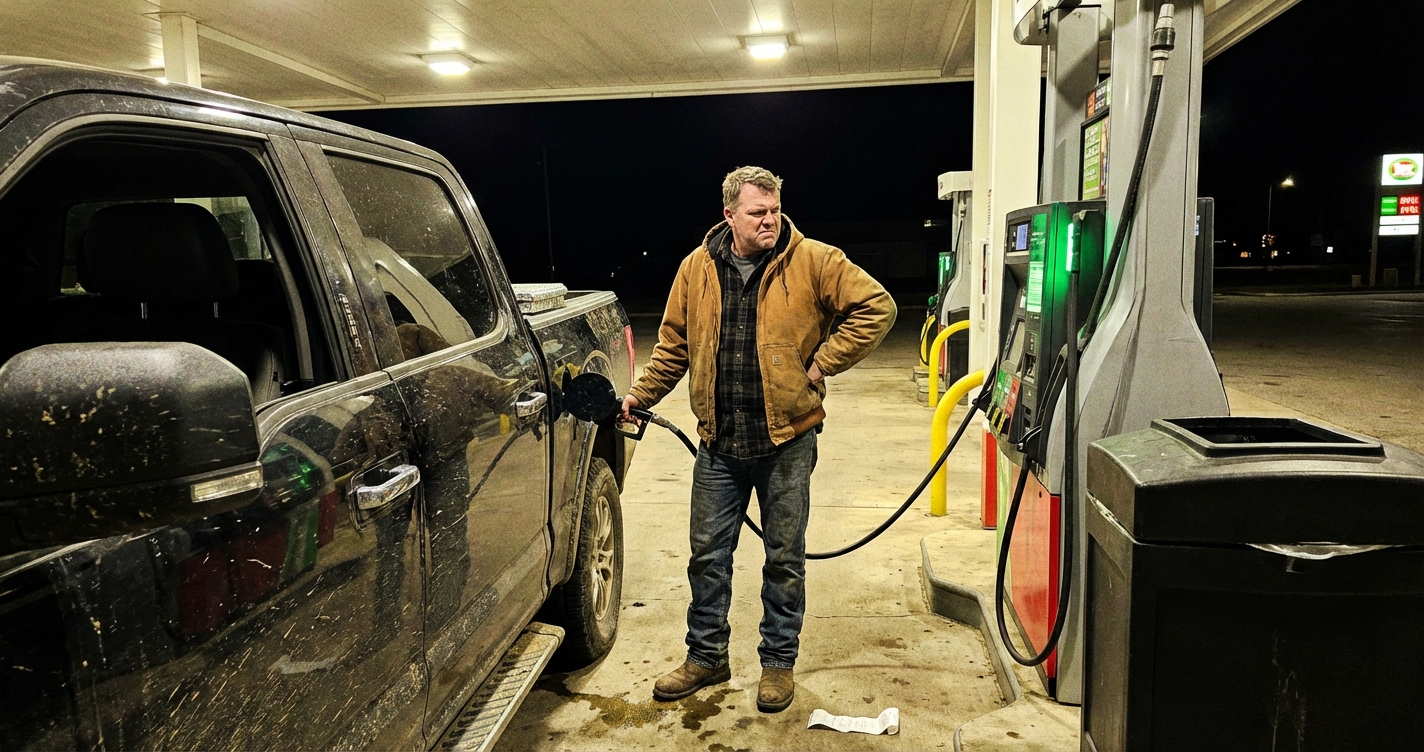
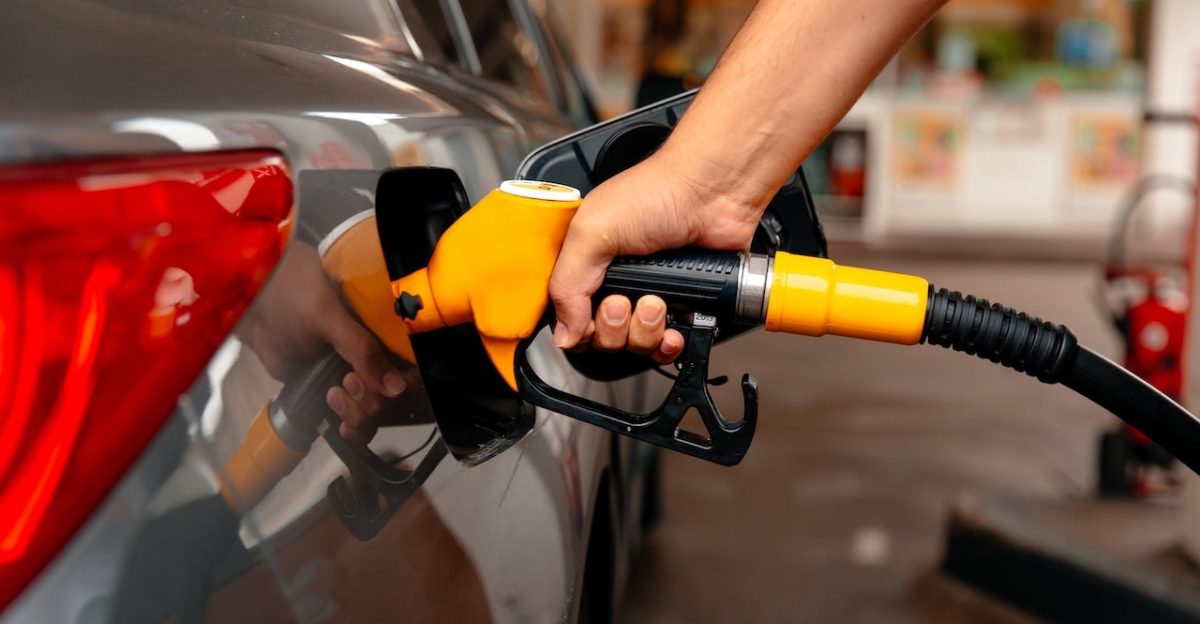
Alabama residents got the worst of it: $52 per person in additional monthly fuel costs, according to the Institute for Taxation and Economic Policy. Mississippi followed at $51. Filling a Ford F-150 cost $144.65 by March 31, a $37 jump from the month before. Kansas, the last holdout, cracked $3 per gallon on March 11, making this the first time since 2023 every single state breached that floor simultaneously. California hit $5.89. Oklahoma, the cheapest, still sat at $3.27. The shock reached every zip code in the country, and the business response was already scrambling to keep up.
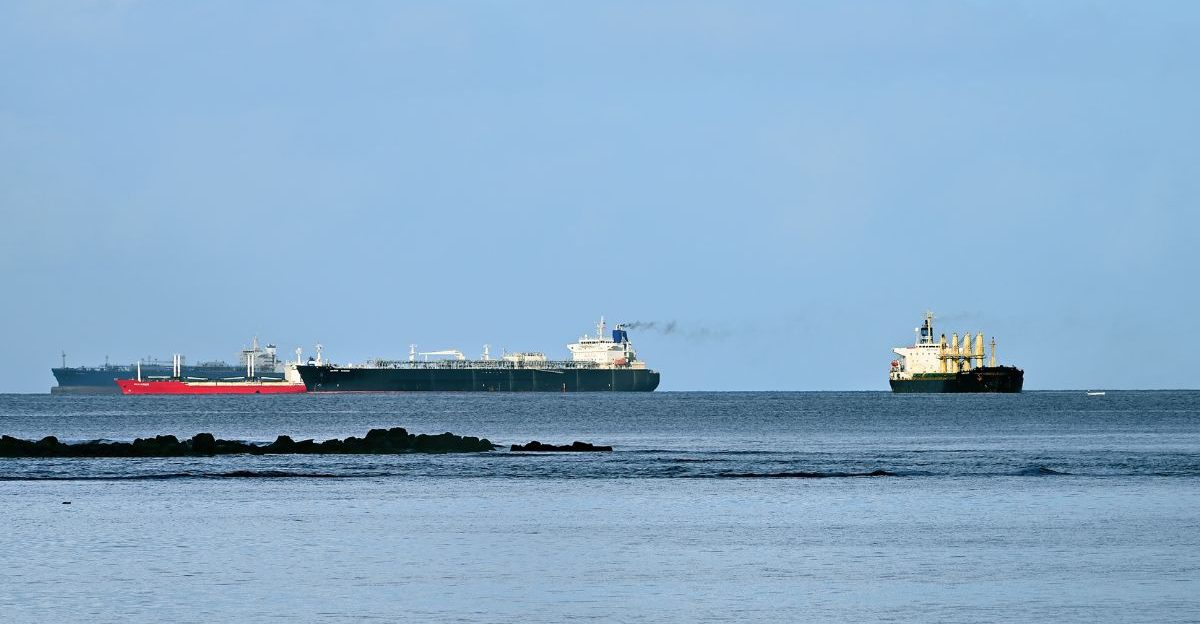
Diesel Broke the Supply Chain
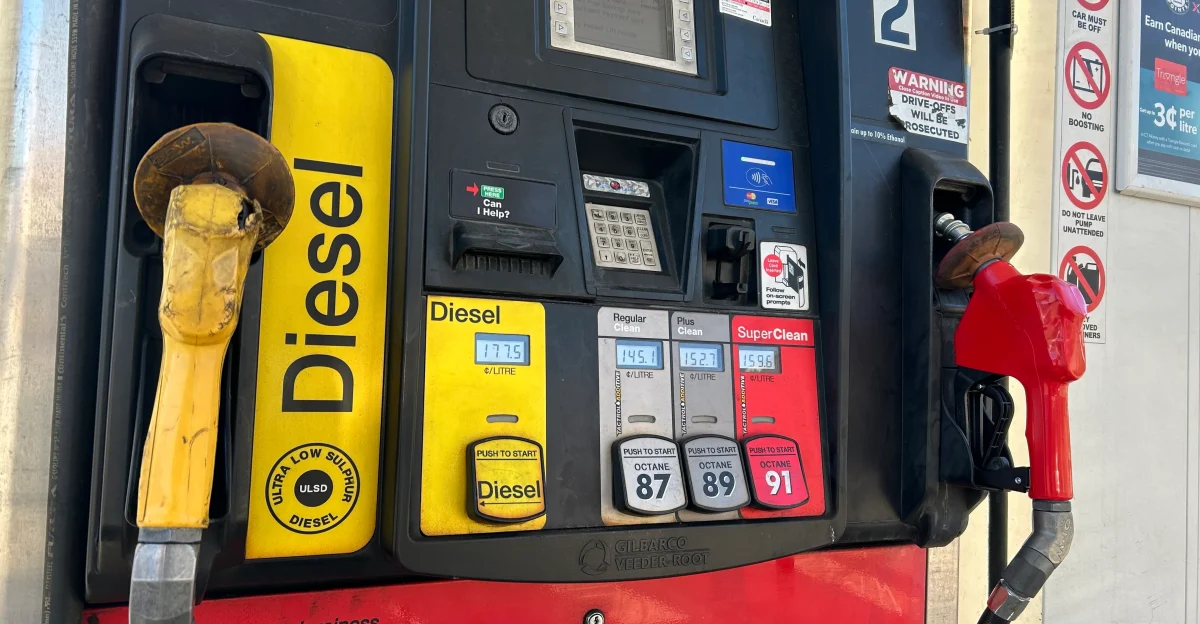
Diesel averaged $5.43 per gallon nationally by April 1, a 50.2% year-over-year increase. Arizona saw 68.8% spikes. California diesel topped $7.52. Every truck on every highway burns diesel. Every freight train, every farm tractor, every school bus. Airlines absorbed jet fuel surges that analysts projected would force 15-25% ticket price increases within weeks. War risk insurance for tanker ships quadrupled from 0.25% to 1% of hull value. A single voyage on a $100 million supertanker now carried $1-3 million in insurance costs alone. Shipping didn’t just get expensive. Shipping started breaking.
Fertilizer Joined the Crisis

One-third of global seaborne fertilizer trade passes through the Strait of Hormuz. When the Strait closed, the urea benchmark price jumped roughly 30% in a single month. Spring planting season across the entire Northern Hemisphere arrived while fertilizer ships sat frozen. On March 18, an Iranian strike destroyed 17% of Qatar’s liquefied natural gas export capacity at the Ras Laffan facility. Nobody was talking about fertilizer when the war started. The grocery aisle is about six months behind the gas pump, and the math is already ugly.
The Machine Behind Every Ripple
Every one of these consequences traces back to the same structural failure: chokepoint dependency with zero redundancy. The Strait of Hormuz carries one-fifth of global oil and nearly 20% of LNG. There is no backup route. Insurance markets reprice risk in real time, and that repricing becomes self-fulfilling. Premiums spike, shipping becomes uneconomical, supply contracts further, premiums spike again. Commodity shocks cascade through fertilizer, diesel, freight, and food faster than any policy response can activate. The fertilizer crisis emerged within two weeks. Policy solutions were still being drafted. Gas station. Grocery store. Feed lot. Your table.
A Voice From Inside the Storm
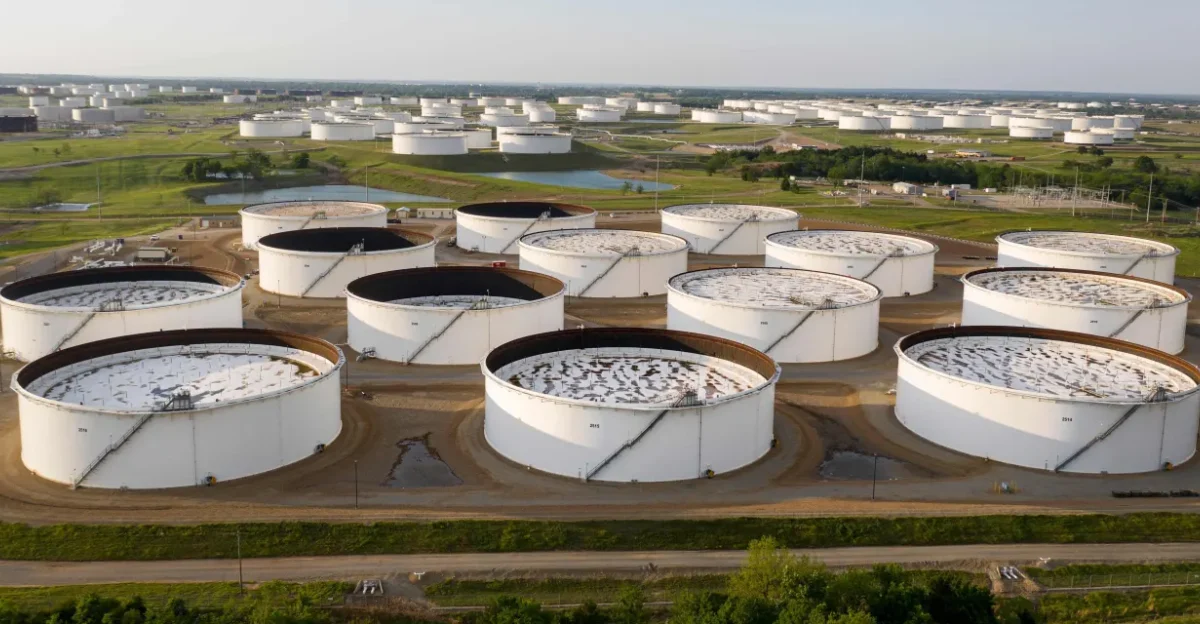
IEA Executive Director Fatih Birol announced the largest coordinated strategic reserve release in history: 400 million barrels from 32 member nations. He called it “a significant move aimed at mitigating the immediate effects of market disruptions.” The underlying math told a different story. That release covers roughly 20 days of the supply gap at current deficit rates. Spot crude still hit $141.36 per barrel, the highest price since the 2008 financial crisis. One tanker shipping analyst described charter rates simply: “It’s simply unimaginable.” The reserves bought time. They bought nothing else.
New Rules for a Broken Market
This disruption surpasses the 1973 OPEC embargo, the 1979 Iranian Revolution, and the 1990 Gulf War in percentage of global supply immediately blockaded. It set a new precedent: geopolitical conflict is now the dominant economic risk, identified by 69% of economists as their top concern compared to 8% just months earlier. White House officials privately discussed $150 oil scenarios while publicly downplaying the crisis. Politico reported contingency planning for sustained triple-digit crude. The Brent spot premium reached $81.36 above the pre-war baseline. Energy markets stopped treating this as a temporary shock and started pricing it as a structural shift.
Who Profits, Who Pays
Poor families spend 8-12% of income on fuel. Wealthy households spend 1-2%. This crisis functions like a regressive tax that hits hardest at the bottom. Texas drivers alone absorbed $1.037 billion in additional costs in one month. Proposed gas tax holidays would save families $5-13 while costing states $40-200 million monthly. Meanwhile, Asia imports 75% of Middle Eastern oil and 59% of its LNG exports, facing disproportionate exposure. Developing nations dependent on fertilizer imports face planting seasons with empty supply chains. The pain distributes downward. The profits concentrate upward. And the cascade still has one more turn.
The Cascade Isn’t Finished
By April 2, some ships began running the southern Strait through Omani waters. Tentative. Dangerous. Analysts warn of a two-week lag before the full supply destruction propagates, meaning peak oil prices may not arrive until mid-April. If the Strait stays closed beyond 90 days, crude could reach $150-180 per barrel, triggering demand destruction and recession. The administration promised sub-$2 gas. It delivered $4.06 in 32 days. The system that produced this crisis has three exits: ceasefire, sustained high prices that crush demand, or energy transition. The first is unavailable. The second is already happening. The third was explicitly reversed. Understand that, and you understand more about American energy than most people in Washington.
Sources
Institute on Taxation and Economic Policy, “These States Are Most Impacted by the Spike in Gas Prices.” ITEP, March 23, 2026.
AAA, “National Gas Average Jumps One Dollar in One Month.” AAA Newsroom, March 26, 2026.
International Energy Agency, as reported by Al Jazeera, “IEA Announces Release of 400 Million Barrels of Oil. But Is It Enough?” March 13, 2026.
SmartAsset, “Gas Prices Hit Records in 2026: State by State Breakdown.” SmartAsset, March 31, 2026.
CNBC, “Brent Oil Price for Actual Cargo Soars to $141, Highest Level Since 2008.” CNBC, April 2, 2026.
Goldman Sachs, “How Will the Iran Conflict Impact Oil Prices?” Goldman Sachs Insights, March 2, 2026.