$1.67 Trillion Auto Debt Crushes 5 States Where Americans Surrender Half Their Paycheck
America’s auto loan debt has reached $1.67 trillion as of Q4 2025, and in 5 states, households are now spending close to half their income just to own and operate a car. Data from the Federal Reserve Bank of New York and a 2025 GoodCar analysis reveal where this burden hits hardest and why it continues to grow. Rising costs for insurance, fuel, and maintenance are pushing total ownership expenses higher, especially in regions where driving is unavoidable. The result is a financial strain that reshapes everyday budgets in ways many did not expect.
Why This Ranking Holds Up
This ranking avoids exaggeration and rests on verified data. A 2025 GoodCar analysis found the highest car-cost-to-income ratios ranged from 42.8% to 46.9%, meaning households spend close to half their income on total car ownership, not just loan payments. That distinction matters because the headline reflects a near-half share, not a literal majority. The Federal Reserve Bank of New York confirms the broader $1.67 trillion debt backdrop, while GoodCar identifies where the burden is most intense. The numbers align, and the underlying costs reveal even more.
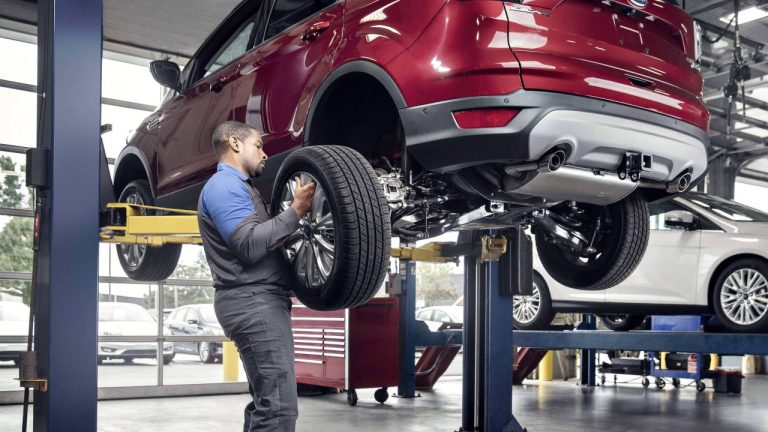
Ownership Costs Add Up Fast
Car ownership stretches far beyond a monthly payment. Insurance, fuel, maintenance, registration, taxes, and repairs combine into a full cost picture that quietly expands over time. GoodCar’s analysis measured total ownership expenses against income, capturing this broader financial strain. Louisiana offers a clear example. Insurance.com reported the nation’s highest 5-year ownership cost there at $39,417, showing how expenses accumulate well beyond financing. These layered costs help explain why some states rise sharply in the rankings, especially where driving is unavoidable and expenses stack quickly.
Why Certain States Stand Out
The states on this list share a pattern. Lower household incomes meet high transportation dependence and rising ownership costs, pushing the car-cost-to-income ratio higher. GoodCar’s state analysis shows this combination is especially common across parts of the South and Appalachia. In many areas, driving is not optional, making these expenses unavoidable regardless of income level. The issue centers on necessity rather than luxury, which is why the burden feels so intense. With that context, the rankings begin to reveal which states face the sharpest strain.
5 – Kentucky

Kentucky ranks 5th, with car ownership expenses reaching 42.8% of household income. GoodCar’s 2025 analysis places it at the lower end of this top 5, yet the burden remains striking. Devoting over 2 in 5 dollars to transportation limits how households allocate money elsewhere. Housing, groceries, healthcare, and savings all compete with this fixed cost. Even at this level, the pressure is clear and persistent, especially for families with limited income flexibility. The numbers already feel heavy here, yet the next state shows how quickly they rise.
4 – West Virginia

West Virginia ranks 4th, with car ownership costs consuming 43.7% of household income. According to GoodCar, this places the state just above Kentucky, showing how small income differences can sharply increase financial strain. Many residents live in rural or small-town areas where driving is essential for work and daily life. That reliance makes reducing transportation costs difficult. When nearly half of income goes toward keeping a car running, budgets tighten quickly. The climb from here becomes even steeper, as the next state approaches a critical threshold.
3 – Louisiana

Louisiana ranks 3rd, with car costs absorbing 45.8% of household income, bringing households close to the half-paycheck mark. GoodCar identified Louisiana as one of the most car-burdened states, and external data reinforces that position. Insurance.com reported the highest 5-year ownership cost nationwide at $39,417, driven largely by elevated insurance premiums. Those higher premiums amplify total expenses, pushing overall costs upward. With income levels unable to keep pace, the strain intensifies quickly. The gap narrows further in the next state, where the ratio climbs even closer to half.
2 – Mississippi

Mississippi ranks 2nd, with car ownership expenses equal to 46.7% of household income. GoodCar’s 2025 analysis places it just behind New Mexico, yet clearly above the rest of the list. At this level, nearly half of household earnings go toward transportation. The impact reaches beyond convenience. A vehicle becomes a major financial obligation that shapes daily spending decisions. Essentials such as food, rent, and healthcare compete with this fixed cost. With the margin so tight, the final state shows how far the burden can stretch.
1 – New Mexico
New Mexico ranks 1st, with car ownership costs reaching 46.9% of household income, the highest share in the country. GoodCar reported a median household income of $50,822 alongside average car ownership costs of $23,853, a gap that highlights the strain. The data places New Mexico as the most car-burdened state in the nation by this measure. Nearly half of income goes toward keeping a vehicle on the road, leaving limited room for other needs. The broader implications of this pattern extend far beyond one state.
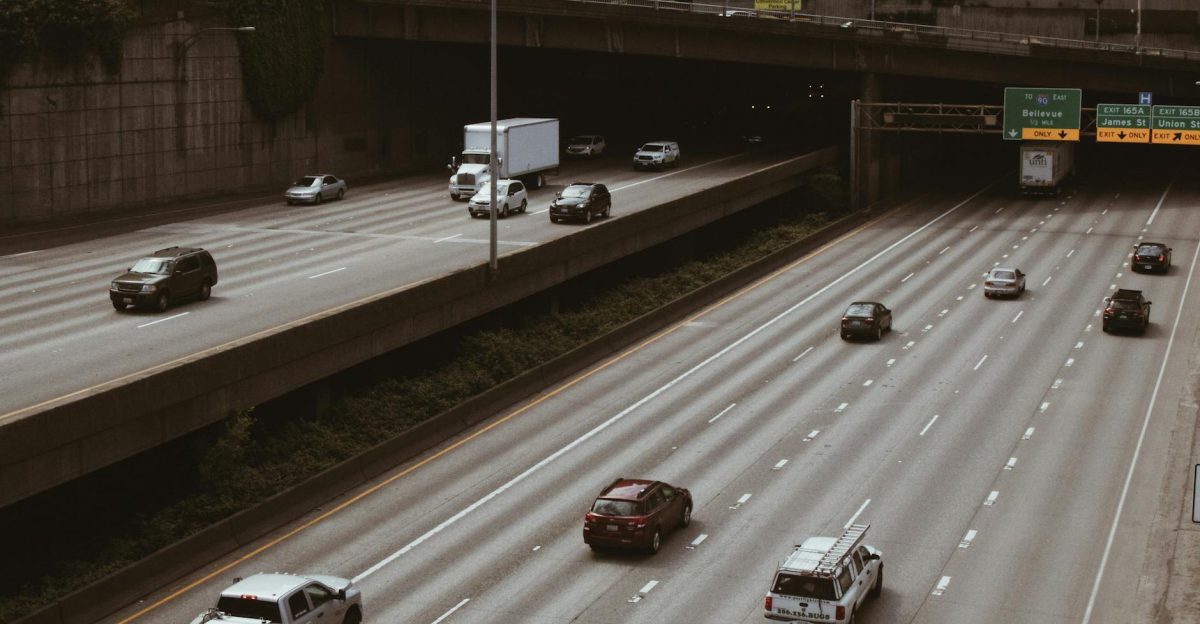
What This Means For Households

These 5 states highlight how transportation costs can reshape household finances across the country. When nearly half of income goes toward owning and operating a vehicle, flexibility disappears quickly. The Federal Reserve Bank of New York’s $1.67 trillion auto debt figure shows this is not a local issue but a national one. Rising costs, combined with steady reliance on cars, create ongoing pressure for millions of households. Understanding where the burden is highest offers a clearer view of how deeply it affects everyday life.
Sources:
Quarterly Report on Household Debt and Credit. Federal Reserve Bank of New York, February 2026.
Household Debt Balances Grow Modestly; Early Delinquencies Rise for Student Loans, Credit Cards and Auto Loans. Federal Reserve Bank of New York, February 2026.
5 States Where Americans Are Spending Half Their Income on Cars. Yahoo Lifestyle, December 2025.
5 States Where Americans Are Spending Half Their Income on Cars. GoBankingRates, December 2025.
Total Cost of Car Ownership by State in 2026: The Cheapest and Most Expensive. AOL, Insurance.com, 2026.